Board-ready reports in one click
Everything leadership and payroll need — the numbers, the detail and the story — exported to branded Excel and PowerPoint, straight from live data.
The reporting hub
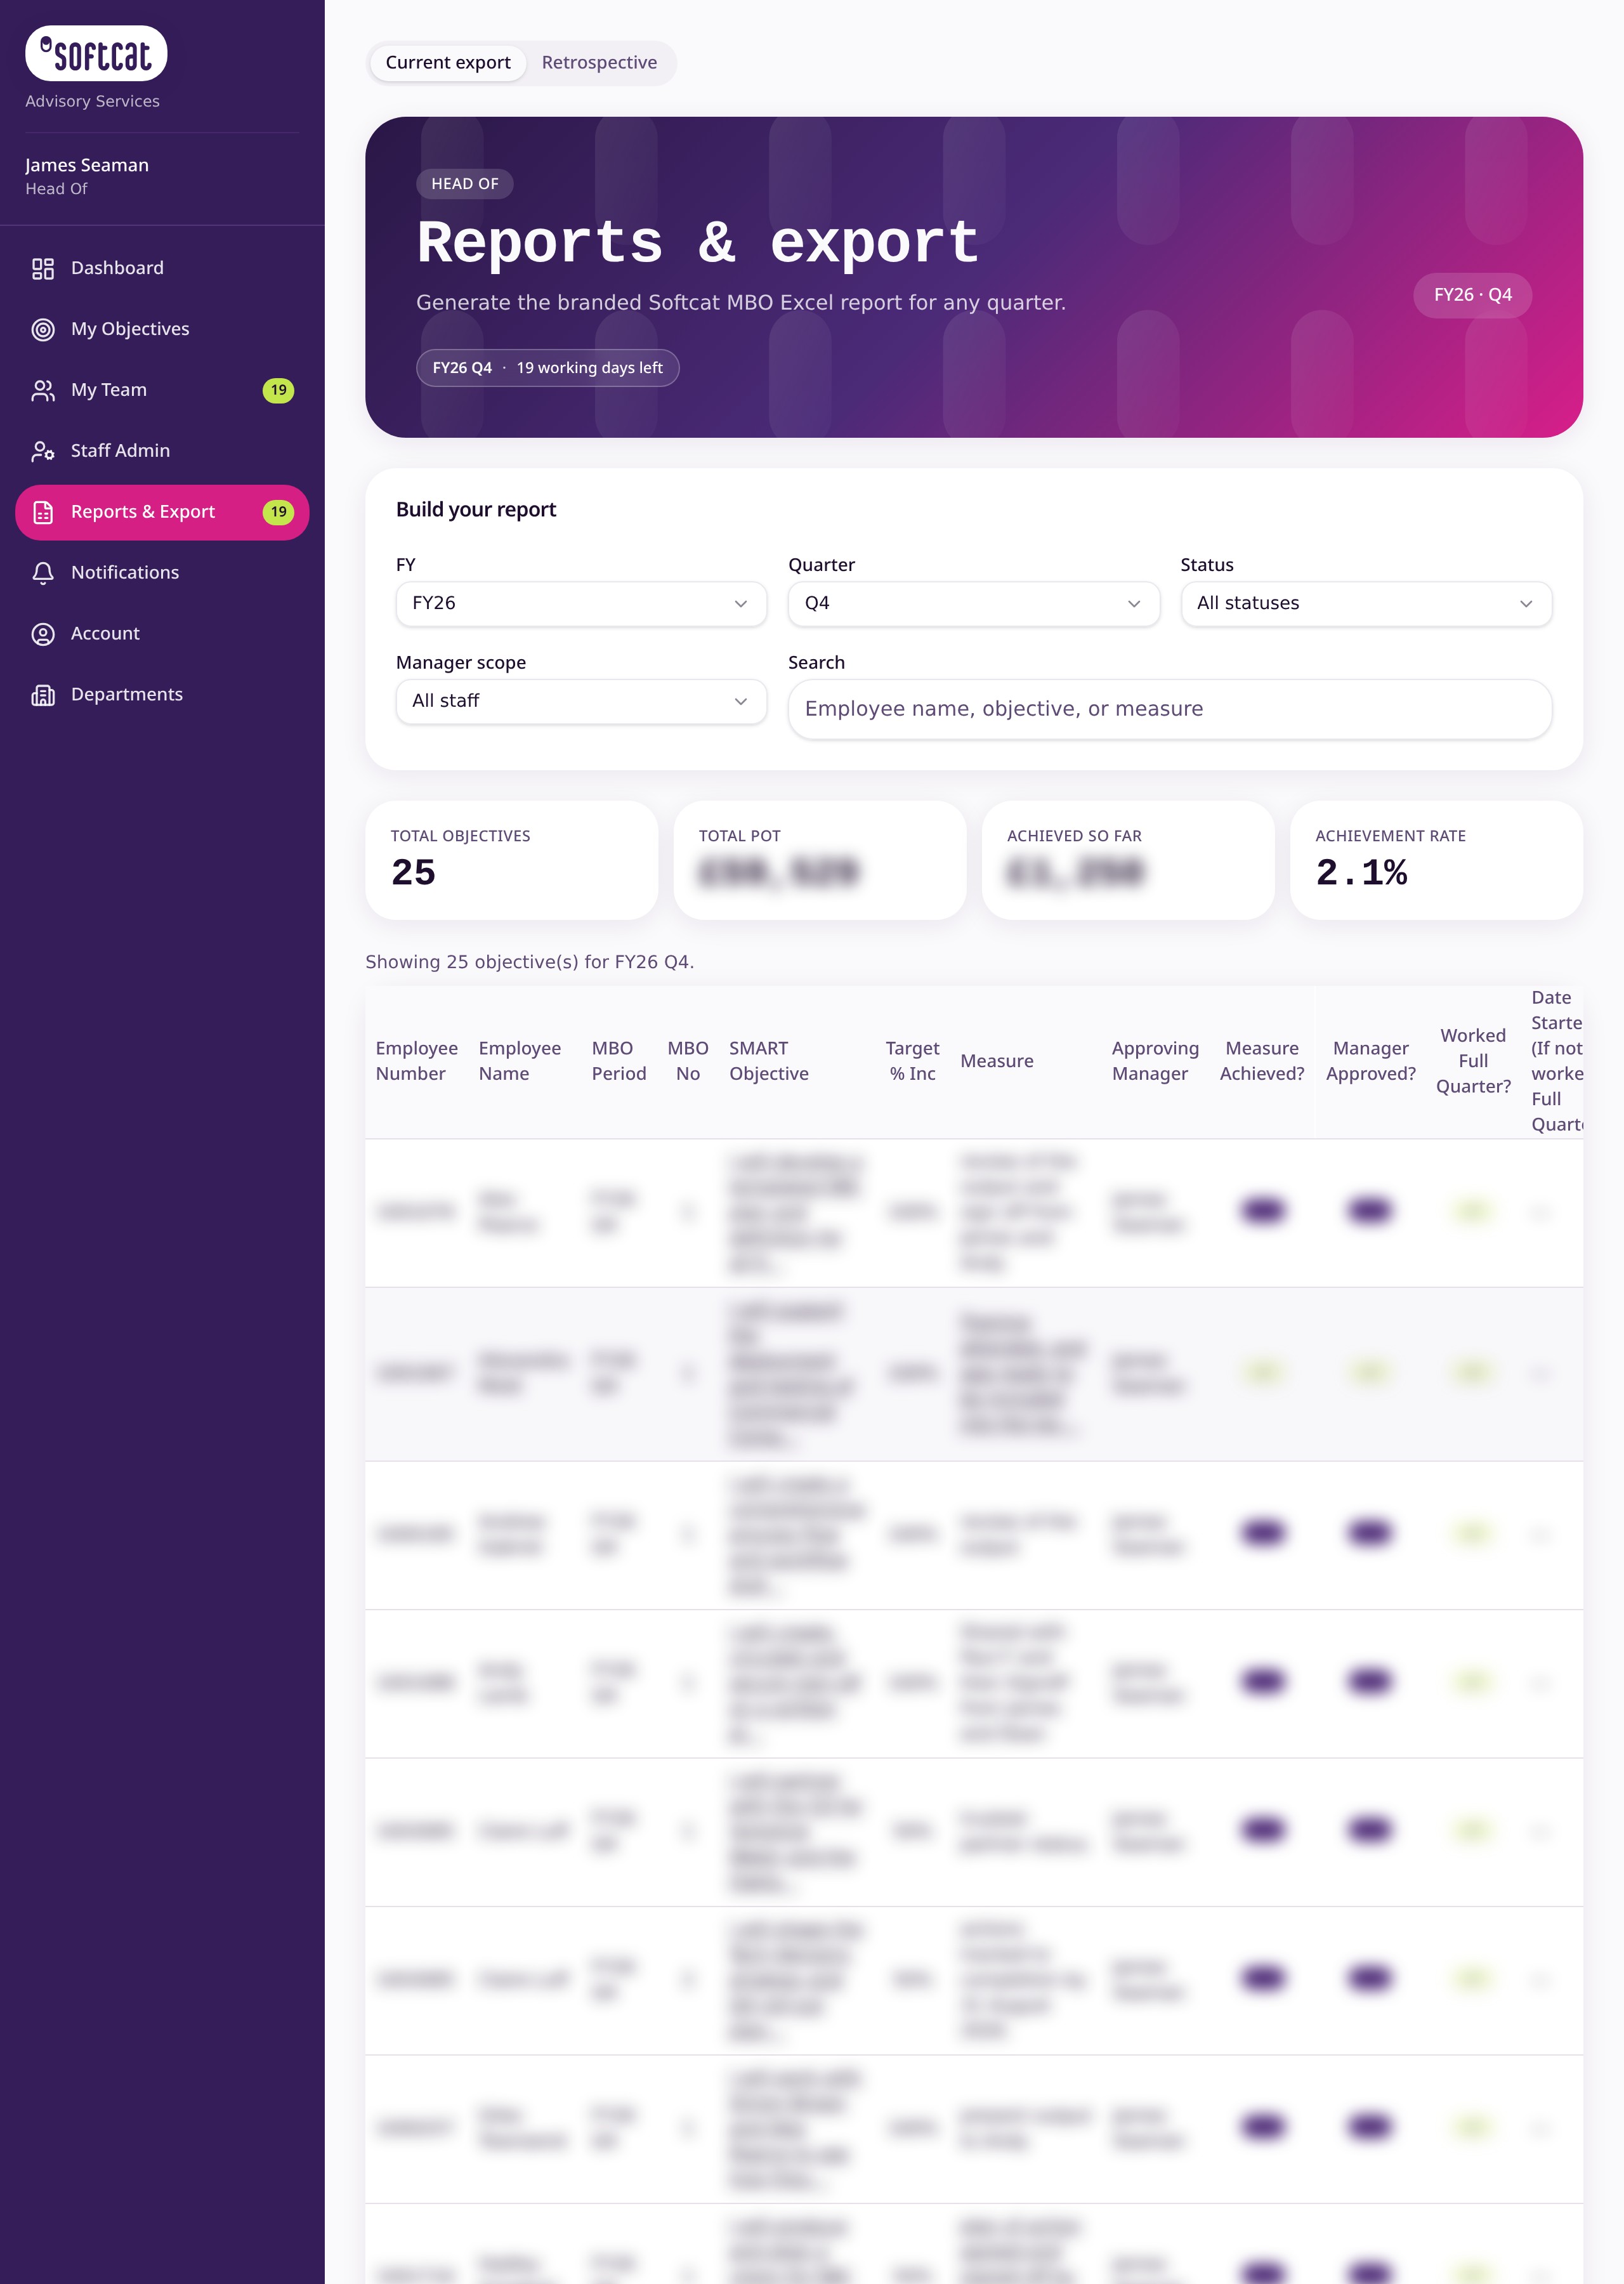
One screen, the whole picture
Leadership can build any view of the quarter — filter by team, status or person — and watch the totals update live before exporting. No stitching spreadsheets together by hand.
Flexible filters
Slice by fiscal year, quarter, status, team or search for a specific person.
Live totals
Total pot, achieved-so-far and achievement rate calculated automatically.
Exports
The formats leadership already uses
Branded Excel report
A full, formatted Softcat spreadsheet of every objective, measure, outcome and payout for the quarter — ready for payroll and finance, with no manual clean-up.
PowerPoint summary
A polished slide deck summarising the quarter for leadership and board reviews — generated from the same live data, so it always matches.
Confidence in the numbers
Accurate, consistent, and always current
One source of truth
Reports read directly from live objectives and approvals — what you see is what gets paid.
Retrospective view
Look back across previous quarters to compare performance and spot trends.
Payout ready
Only properly signed-off results count towards the bonus totals.
Hours of reconciliation, replaced by one click
Leadership gets accurate, board-ready reporting on demand — and payroll gets a clean, signed-off dataset without chasing managers or rebuilding spreadsheets.